Moving the Goalposts
On February 2, I told you that a window of opportunity for stocks to move lower had opened. There were a couple reasons I thought that the bullish mood that carried the S&P 500 10% higher during the first month of 2023 might be souring.
For starters, there’s the simple observation that it’s a lot easier to be bullish on stocks when the S&P 500 is at 3,800 than after it has rallied to 4,200.
Or for a more specific example, we had Meta (NASDAQ: META) as on the list for an upside move when it was $120. I wrote that a move to $150 looked imminent. But once the shares blew through that $150 target and hit $190, well, it gets harder to justify buying it. After all, the name of the game is buy low, sell high.
The same is true for the S&P 500. The move to 4,200 was a reasonable outcome once the index broke above November/December resistance at 4,100. But once the expected move happens, then what?
There are plenty of traders out there who will tell you that technical analysis — measuring investors buying and selling behavior — will tell you everything you need to know to make profitable decisions about buying and selling stocks.
For me, it’s not so simple. I believe the biggest mismatches for stock prices occur because of investor expectations. If a stock is overvalued, it’s because expectations are too high. And conversely, it’s when investors are too pessimistic that stock prices become attractive.
And so I want to have a solid grip on what investors are expecting so that I have a sense of when those expectations are getting out of whack with reality.
Moving the Goalposts
Of course, nothing about the stock market or the economy is static. There are no fixed points. The goalposts are always moving…
Right now, most investors probably have a pretty good idea of what crossing the goal line would look like: inflation under control, an end to the interest rate hikes and some assurance that recession is not right around the corner…
Back at the beginning of January, it seemed like the goal line was in sight. Inflation data was trending in the right direction and the Fed was signaling that there would be two more .25 point rate hikes in January and March and that would be that.
But then we got the Nonfarm Payroll number on February 2. And it was a whopper. Economists had agreed that the U.S. economy probably added 188,000 jobs in January and that probably kicked the unemployment rate up a notch, to 3.6%. The actual number of new jobs was 517,000, enough to push the unemployment rate down to 3.4%…
Yesterday, the latest inflation data came in higher than expected. And today, retail sales for January showed a 3% jump. That’s the biggest month over month jump since March 2021. And if you exclude pandemic era retail numbers that were helped along by government stimulus, January’s 3% jump for retail sales was the biggest in a couple decades.
Yep, the goalposts just moved. Again…
But the question now is: where’s the goal line? And what should you do about it?
A Move Lower
As I said earlier, a window of opportunity for stocks to move lower opened on February 2, after that blowout Nonfarm Payroll number. Because it suggests that the historic rate hike campaign is not having the desired effect on the economy.
No surprise that the Fed has upped the rhetoric that its job is not done. And the bond market has priced in a third .25 point rate hike for 2023, due at the May Fed meeting that would take rates to the 5.25% to 5.5% range.
At the same time, Goldman Sachs just lowered its odds for a U.S. recession from 35% to 25%.
The implication is clear: Goldman and the bulls are siding with the U.S. economy. That is to say, that the strength of the U.S. economy will keep it out of recession as the Fed lays down a couple more small rate hikes.
Perhaps this is why the S&P 500 has only dropped about 100 points since those Feb. 2 highs.
Frankly, I think stocks are on the verge of a move lower…
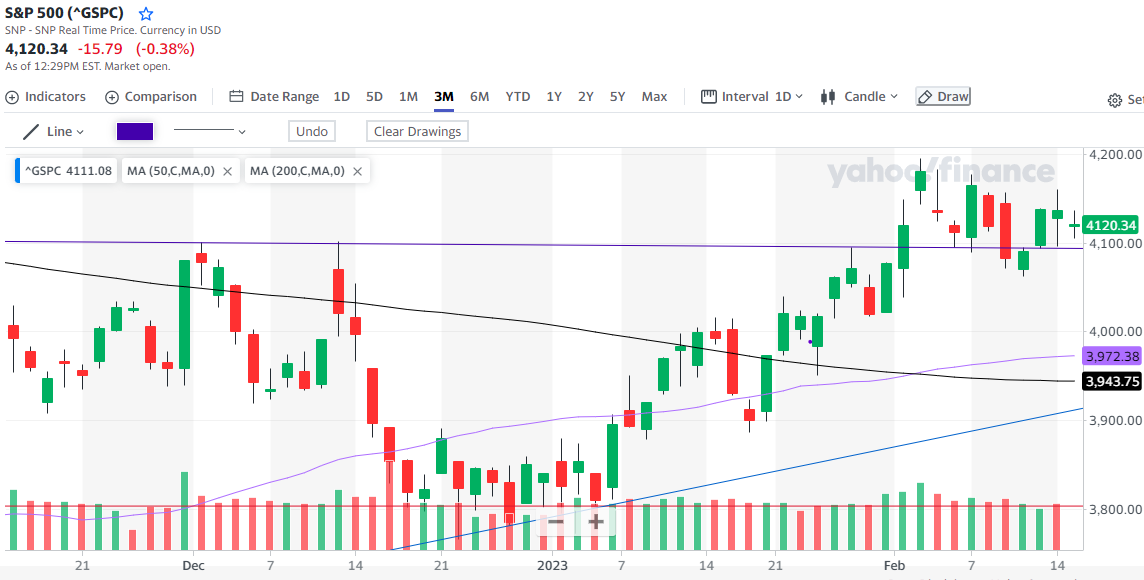
I’ve added the horizontal purple line to show 4,100 support on the S&P 500. Trading has oscillated around that line for the last 8 days. A break below 4,100 puts the 50-day moving average (rising purple line at 3,972) and the 200-day moving average (Black line at 3,943) in play.
I’m looking at some put options on Bank of America for a downside move. The $35.50 strike puts that expire next Friday look pretty good…
That’s it for me today, take care and I’ll talk to you on Friday.
Briton Ryle
Chief Editor and Strategist
Pro Trader Today